Despite the impact of COVID-19 on financial markets, 2020 was another big year for IPOs in Australia. Our rated smaller companies managers were once again active, however given the small size of many floats, it was generally micro-cap funds which benefitted.
Impact of COVID-19 on floats
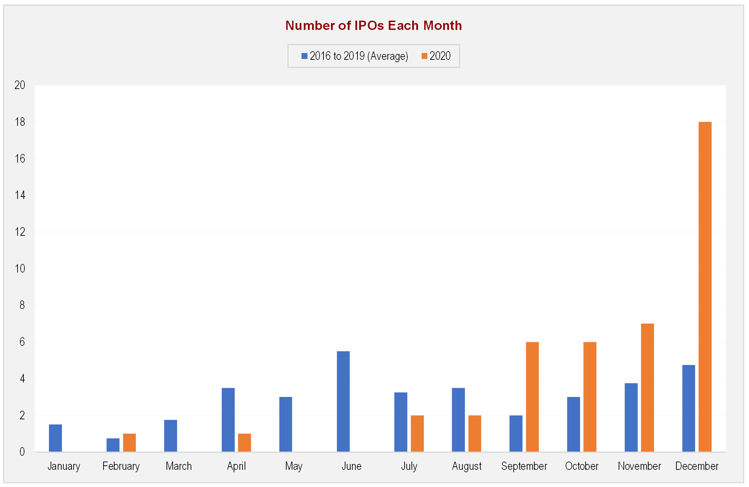
In line with the strict and lengthy lockdowns enforced in March 2020, the Australian IPO market was severely impacted. The chart below highlights the average number of IPOs each month over a four-year period (2016 to 2019), compared to 2020.
Source: Bloomberg, Reuters
As equity markets swiftly recovered from their nadir, propelled by fiscal stimulus and Australia’s success in limiting the spread of COVID-19, confidence returned. The IPO market re-emerged in July and continued throughout the rest of 2020, with many companies seizing the opportunity to list.
Make hay while the sun shines – which companies benefitted?
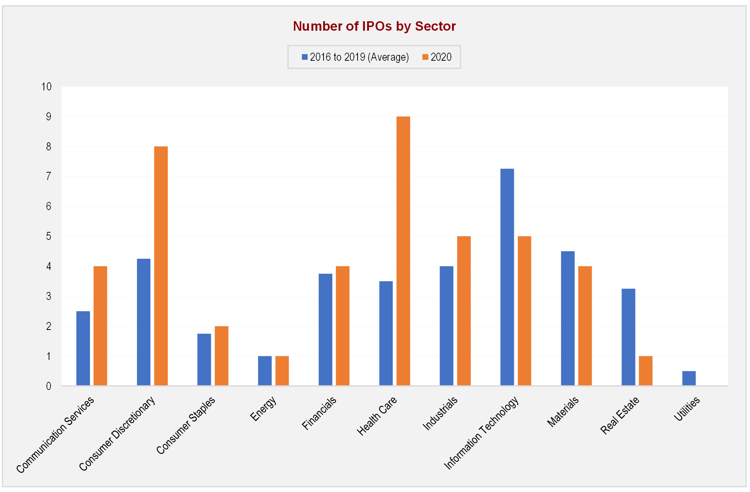
The chart below contrasts the sector breakdown of IPOs in 2020 with the average over the previous four years.
Source: Bloomberg, Reuters
As the world continued to sharpen its focus on health outcomes, it came as no surprise that the health care sector saw strong growth in listings. In addition, the consumer discretionary sector experienced a significant uplift, which initially appeared to be counterintuitive given the impact of lockdowns. However, the consumer businesses that benefitted from COVID-19 were often those with a strong online presence, with companies such as Adore Beauty, MyDeal.com.au, and Cettire listing in the December quarter.
Did it pay to be selective in 2020?
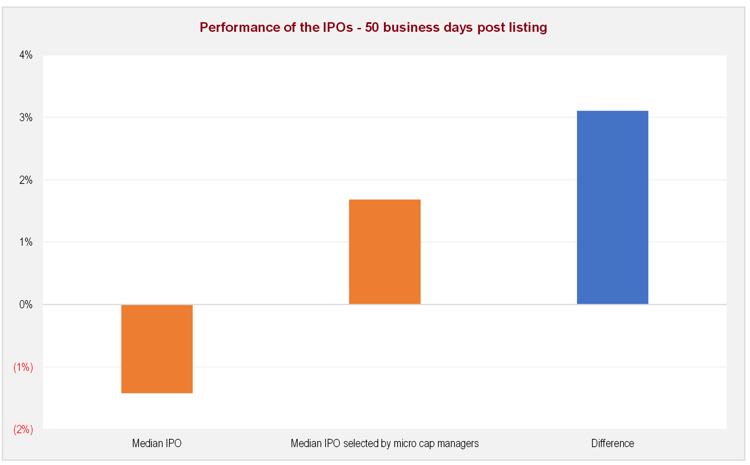
As our managers were once again strongly involved in the IPO market, we’ve assessed the performance outcomes of active management. The chart below shows the excess returns of the median IPO in 2020, versus the excess returns of the median IPO selected by our managers in 2020.
Source: Bloomberg, Reuters, Fund Managers, Zenith
Although the median IPO underperformed the market over the 50 days after listing, it’s pleasing to see our managers were able to generate positive excess returns from being selective in their IPO participation.
How does this compare to 2019?
The overall strong performance of IPOs in 2019 was exceptional, picking a winner relative to the market was almost like shooting fish in a barrel.
The chart below compares the value added by managers being selective with IPOs in 2019 and 2020, respectively.
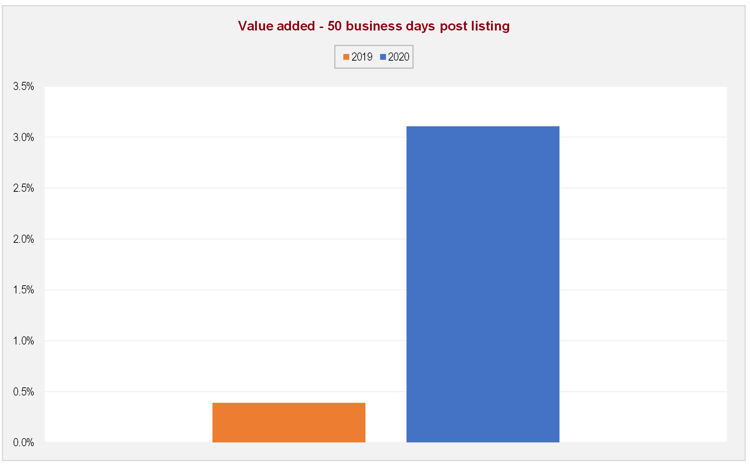
Source: Bloomberg, Reuters, Fund Managers, Zenith
Why was this the case?
We believe the value of active management is the strong focus on quality and capital preservation. The histogram below highlights the distribution of IPO excess returns for 2019 and 2020.
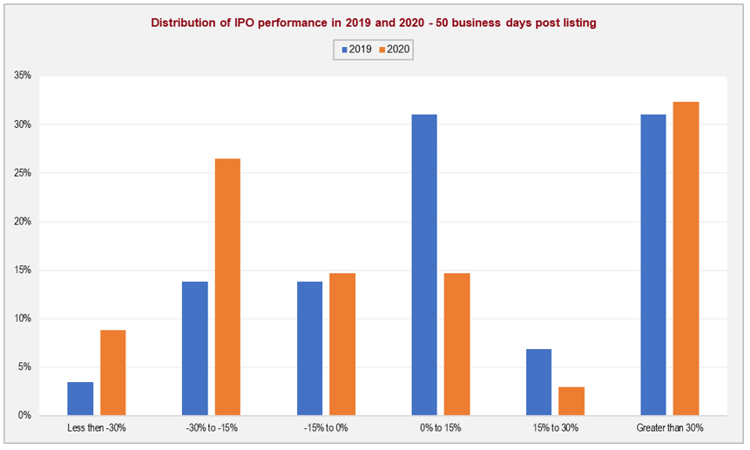
Source: Bloomberg, Reuters
Given the distribution of IPO performance in 2019 was strongly skewed towards positive excess returns (approximately 70%), active managers had less scope to demonstrate value add. However, the significantly greater proportion of negative IPO outcomes in 2020 (approximately 50%), provided active managers with greater opportunities to prove their worth.
A focus on quality, an active small cap manager’s edge
As demonstrated by the performance outcomes of IPO participation, a focus on quality leads to stronger outcomes. We believe this relationship extends to broader equities, with the vast majority of active managers incorporating a focus on quality in their respective investment processes.
Quality from an Australian equities’ perspective
To explore the concept of quality in the context of Australian equities we utilised three key metrics:
-
Return on Equity
-
Debt to Equity
-
ISS Quality Score (a governance score)
We normalised these metrics and combined them to derive an overall quality score for each index constituent.
Large caps versus small caps
It’s logical to assume that larger companies exhibit higher quality characteristics than smaller companies.
To provide a comparison, we divided the S&P/ASX 300 Index into larger companies (ASX 100) and smaller companies (ASX 101-300). The chart below compares the average quality score for larger companies1 relative to smaller companies2.
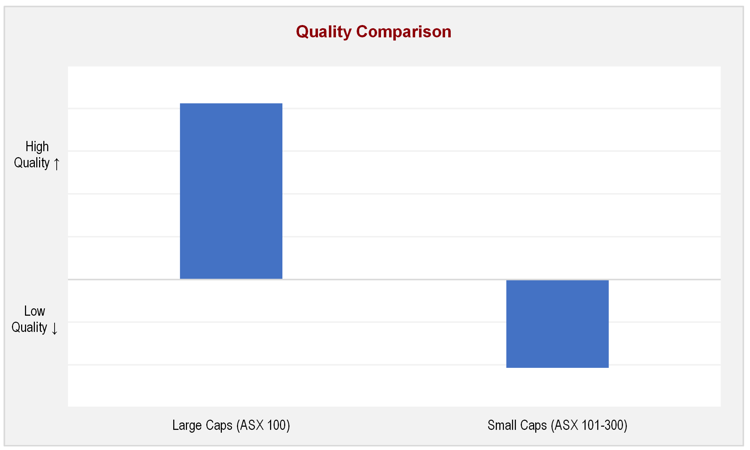
Source: Bloomberg, Zenith
In line with expectations, our analysis shows smaller companies are generally lower quality than their larger counterparts. However, does investing in a lower quality universe necessarily result in a lower quality portfolio?
The chart below summarises the average quality scores of our rated smaller companies funds, relative to the quality scores of the respective indices.
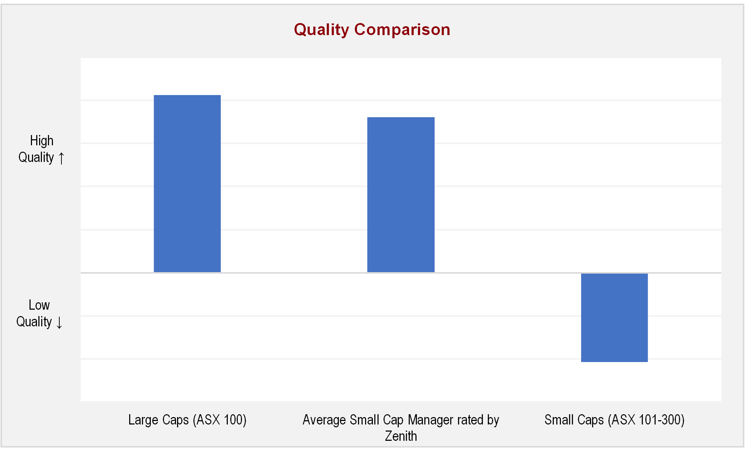
Source: Bloomberg, Zenith
Our analysis shows, on average, our rated small cap managers held significantly higher quality portfolios than the smaller companies universe whilst being slightly lower quality than the larger companies universe.
To quote legendary investor Benjamin Graham:
“Investment must always consider the price as well as the quality of the security.”
1 S&P/ASX 100 Index (Top 100 constituents by market capitalisation of the S&P/ASX 300 Index)
2 S&P/ASX Small Ordinaries Index (Bottom 200 constituents by market capitalisation of the S&P/ASX 300 Index)