Liquidity in fixed income markets is a fluid concept (pun intended) that is plentiful in normal market conditions and can quickly disappear in a dislocated market – akin to a tide going out. The seizure of the US Treasury and global credit markets amid the COVID-19 crisis, highlighted the systemic liquidity risk facing bond investors and how a decline in liquidity can result in large drawdowns.
This Insight’s piece explores the nature of liquidity in fixed income markets and the structural factors contributing to its decline over the past decade. Using the performance of Zenith’s International Fixed Interest – High Income’ universe, we illustrate the ‘V shape’ profile typically associated with liquidity-related drawdowns and why it’s important to manage client expectations and invest with an appropriate time horizon.
Some background
The definition of liquidity or liquidity risk refers to a market participant’s ability to execute purchases/sales in size, cost effectively – with a low bid-offer spread and a small market footprint. Liquidity risk changes through different phases of the credit cycle, and most notably, positively correlates with ‘risk off’ environments (i.e. increases in these periods).
Thus, in the most recent COVID-19 shock, liquidity risk spiked, resulting in credit markets dislocating, and in some instances, credit curves inverting with AAA securities trading wider than AA securities in the same sector/market.
The effects of liquidity risk are captured in the movement of credit spreads and the tendency to accelerate or ‘gap’ as credit shocks unfold. This can result in significant mark-to-market volatility with large negative returns. Interestingly, these outcomes are often decoupled from the credit worthiness of borrowers (or default risk) and their ability to meet future coupon and principal repayments.
The following chart plots the performance of Zenith’s International Fixed Income – High Income universe* through the most recent COVID-19 crisis the period 1 Feb 2020 to 31 March 2020.
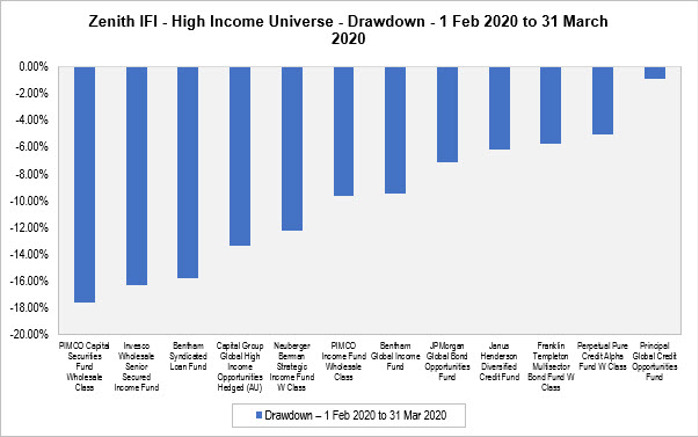
Source: Zenith Investment Partners; * Aberdeen Standard EM Debt (LC) and Colchester EM Bond Fund omitted due to the impact of currency effects
Over the analysis period, the average drawdown was -10%, with several managers experiencing declines in excess of 15%. While negative returns are expected over shorter time periods, the magnitude of these drawdowns exceeded the expectations of many advisors and investors. It is important to highlight that performance figures are based on exit prices and therefore incorporate each manager’s sell spread. Through March, Zenith observed sell spread increases of up to 2%, which had the effect of magnifying negative returns, albeit safeguarding remaining investors from transaction costs incurred by redeeming investors.
Finally, when assessed relative to each manager’s excess return target, in many instances, drawdowns represented at least three years of targeted excess returns, lost in a two-month period. So, what is driving these liquidity-driven events?
The Decline of Liquidity in Fixed Income Markets
The origins of the great liquidity dry-up can be linked to government regulations post the global financial crisis (GFC), particularly with respect to the banking sector’s ability to hold corporate bonds on balance sheet. For example, Basel III introduced a range of prudential measures and capital charges to address the potential for mark-to-market losses, which reduced the attractiveness of low-margin, balance sheet intensive business, such as market making in corporate bonds.
With the banks lowering their appetite for corporate bonds and transitioning from investing in a principal capacity, to an agency model where they match buyers and sellers to collect a trading margin, there is less natural liquidity support for these markets. Moreover, physical bonds are generally traded over-the-counter (OTC), via dealers (usually banks) and unlike equity markets, there is no central exchange to facilitate a deep, two-way market. In Australia, most of the secondary market trading is not executed on an electronic platform and we are yet to develop a framework for reporting turnover data.
While banks have been reducing their capacity and willingness to hold corporate bonds, credit markets have experienced record growth in issuance, as companies locked in record low funding costs and increased the maturity of their debt programs. We believe that this rate of growth has outstripped the market’s ability to support a smooth functioning secondary market.
To illustrate this, the following chart depicts the size of the US investment grade credit market on the left-hand axis and the daily traded volume data as a proportion of the size of the market on the right-hand axis. Daily turnover data is based on mandatory transaction reporting data from broker-dealers to Financial Industry Regulatory Authority (FINRA) for the period 1 January 2007 to 30 April 2020.
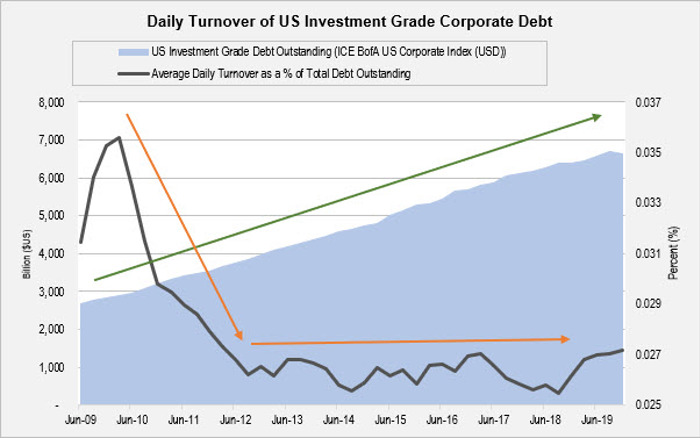
Source: BofA and FINRA - Trace Data
Over the analysis period, the size of the market has increased by approximately 29% p.a. while average daily volume traded has oscillated between 2.5% and 3.0% of total debt on issue. In terms of annualised growth, daily turnover has increased by 23.9% p.a. over the period, with the slower growth rate contributing to structurally higher liquidity risk.
The most visible form of liquidity risk is bid-offer spreads, which reflects the difference between the price a broker-dealer is willing to buy/sell a bond. While these are generally tight in normal market conditions (i.e. less than 0.05%), they can reach 2% in stressed environments, particularly when a bank has experienced trading losses and is reticent to assume principal or balance sheet risk.
Through the COVID-19 crisis, the domestic credit market experienced a major liquidity shock as the secondary market effectively closed and the market was awash with forced sellers and very few buyers. This was reflected in bid-offer spreads across all segments of the markets including AGS, semi-government bonds and corporate securities. To illustrate this, the following charts highlight the bid-offer spreads in AGS and semi-government securities from 1 January 2020 to 7 May 2020.
Bid-Offer Spreads
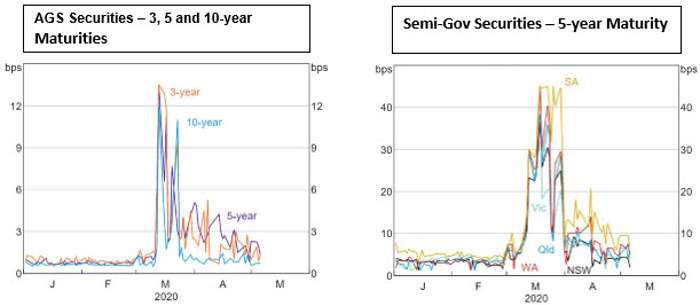
Source: RBA
In the case of the AGS market, bid-offer spreads increased from approximately 0.01% at the start of the period to more than 0.12% at the height of the crisis. The semis market experienced larger increases, with spreads rising from 0.05% to above 0.40%, most notably some of the smaller issuing states, such as SA and WA displayed wider bid-offer spreads. While the spread changes are generally small, if multiplied by the credit spread duration of a bond, the capital losses can be significant.
Eventually the Tide Returns
In a distressed environment, markets are driven by sentiment and behavioural finance anomalies such as fear, panic and ultimately capitulation. In the capitulation phase, outsized negative returns are experienced where prices or spreads decouple from credit fundamentals and actual default risk. Perversely, in these periods, the greatest opportunity for maximising financial gain is observed.
Through a liquidity-driven sell-off, markets gradually normalise with the amount of forced selling declining, volatility subsiding and buyers identifying attractive spread opportunities. While this note addresses the spread movements in the liquidity crisis, the broader credit cycle can also impact the timing and speed of a recovery. Macroeconomic indicators such as changes in gross domestic product (GDP), industrial production, trade and employment all contribute to investor expectations and the length of the recovery period.
Importantly, liquidity driven shocks typically exhibit a ‘V shaped’ profile where drawdowns have historically been followed by periods of recovery. While each market responds differently, factors such as past trading activity, depth of market quotes, breadth of ownership, and bond-specific characteristics such as issuer, sector, amount outstanding and maturity all influence the speed and path of recovery.
The following chart highlights the ‘V shaped’ performance of Zenith’s International Fixed Interest – High Income universe, and compares each manager’s drawdown over the COVID-19 period with the subsequent recovery over the following three months (i.e. 1 April to 30 June 2020).
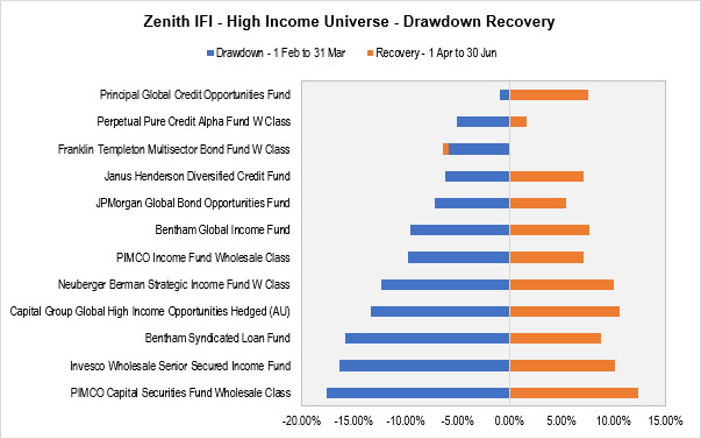
Source: Zenith Investment Partners; *Aberdeen Standard EM Debt (LC) and Colchester EM Bond Fund omitted due to the impact of currency effects
While the universe is heterogeneous in terms of investment approach and underlying markets traded, a common thematic across the peer group has been the speed of recovery, with most managers generally recuperating a large portion of their drawdown in the two months following the initial market shock. While large exogenous events are difficult to forecast, it highlights the importance of manager selection and ensuring clients invest with an appropriate investment horizon.
Conclusion
The COVID-19 crisis has provided an important reminder on the embedded liquidity risk in fixed interest markets and how this can impact investment returns. Moreover, liquidity has systemically declined following the introduction of a range of regulatory and prudential measures post-GFC, making it difficult for the banking sector to hold corporate bonds on balance sheet. As such, fixed income markets are more prone to liquidity-induced drawdowns, which tend to follow a ‘V shape’, with rapid declines in capital values followed by periods of recovery. Provided that investors have the appropriate time horizon and drawdown sensitivity, the tide has a history of coming in!