In recent times, there has been robust debate within the funds management industry regarding the performance divergence between value and growth investment styles.
Growth investors have significantly outperformed their value counterparts since the global financial crisis (GFC), claiming their strong stock selection skills have held them in good stead.
Conversely, value investors have argued that the strong bull market, driven by low and falling interest rates since the GFC, has led to value’s significant underperformance. A typical value investor purchases stocks that they believe are cheaper than other available investment opportunities, which leads to a higher “margin of safety”. As such, value investors were quietly hoping for a significant market drawdown to demonstrate their ability to outperform…
How did the value and growth investment styles perform in the COVID 19 market drawdown of February and March 2020?
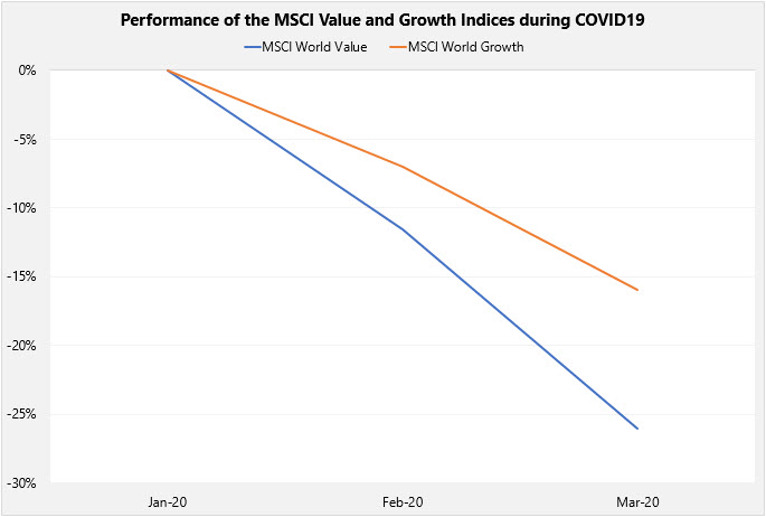
From a global equity perspective, we have used the MSCI World Value and MSCI World Growth indices as proxies for value and growth stocks. The following chart shows the performance of value and growth stocks during the COVID19 market drawdown.
Source: Reuters
Disappointingly or satisfyingly, depending on your perspective, value significantly underperformed growth over the short drawdown period. Compared to the MSCI World Index, value generated a downside capture of 130% and growth captured only 71% of the fall. For context, a downside capture of 100% represents a fall in line with the market index.
How do value and growth stocks historically perform in a bear equity market?
To give investors a better understanding of how the two styles have performed in market downturns prior to COVID19, we have analysed all global equity market drawdowns (as represented by the MSCI World Index) of 20% or greater (the technical definition of a bear market) since 1975.
There were four periods that met the criteria:
- The Black Monday sell off in 1987
- The 1990 US Recession, which included the Gulf War
- The Dot Com Bubble crash from 2000 to 2001
- The GFC, which spanned 2007 and 2008
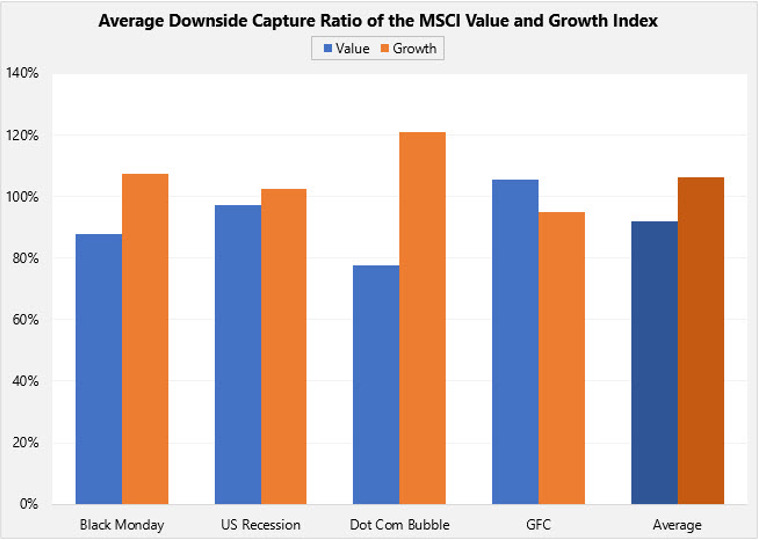
The bear markets are of varying magnitudes, despite all falling more than 20%. As such, we have chosen to analyse the performance of the investment styles through capture ratios. The chart below shows the capture ratios of the value and growth investment styles across the four bear markets.
Source: Reuters
The chart shows that, for three of the four periods, value outperformed growth, with the only exception being the GFC. The average downside capture for value and growth stocks were 92% and 112%, respectively meaning value stocks fell by less than the market while growth stocks fell by more than the broader market.
Why has value underperformed growth this time?
Although the market has not yet recovered from the COVID19 drawdown, and could very well fall further, we have sought to understand the reasons why the value style has not performed in line with prior bear markets.
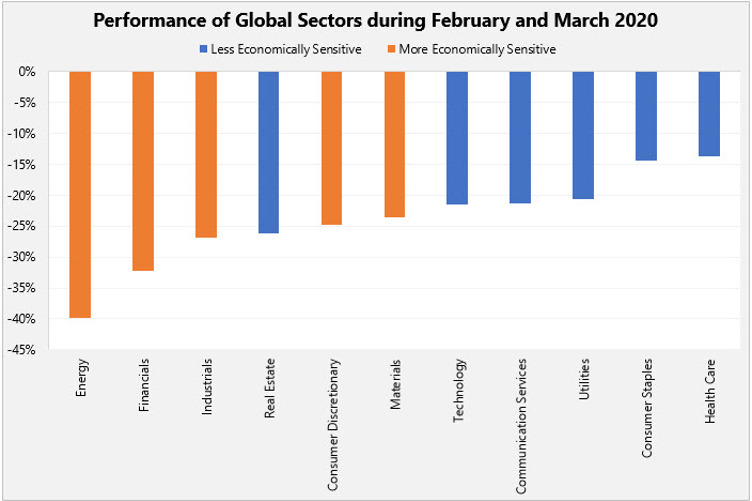
The drivers of performance from a sector perspective are shown in the chart below. We have highlighted the sectors that have been historically less (and more) economically sensitive than the mean.
Source: Reuters
Given the significant demand shock that has been experienced, the more economically sensitive sectors such as energy and consumer discretionary have been hit hard, especially where there has been uncertainty around the earnings profiles of these companies.
However, it is also worth noting that energy stocks faced large headwinds beyond COVID19, given tensions between Saudi Arabia and Russia in relation to the production and supply of oil, which saw a large fall in the oil price during February and March. These tensions were independent of COVID19, however, the combined effect has seen share prices in the sector materially impacted.
On balance, value managers were significantly exposed to economically sensitive sectors whilst growth managers were positioned in the less sensitive sectors.
Why were value managers significantly exposed to these sectors?
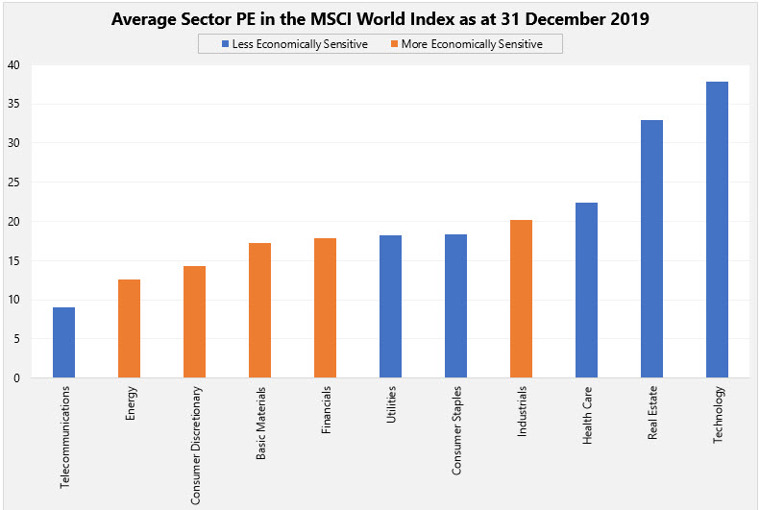
Value managers will tend to invest in stocks trading at a discount to their intrinsic values. Whilst we acknowledge that the price to earnings (PE) ratio is not a perfect measure, it is commonly used to compare the valuations between stocks. Using the PE ratio, we have compared valuations of the sectors prior to the market drawdown. This output is shown in the chart below.
Source: Bloomberg
As the chart above demonstrates, coming into the crisis the ‘cheaper’ sectors (those with lower PE ratios) were some of the more economically sensitive ones.
At this point, we want to reiterate that we are aiming to understand the drivers of performance rather than defending the positioning of value managers. Conversely, during the Dot Com Bubble it was the information technology sector that was hit the hardest. At the time, this was a segment of the market that was strongly supported by growth managers, which led to a significant level of underperformance over the period.
How do the value and growth styles perform in a bear market recovery?
Whilst it is vital to preserve capital in a market downturn, it is equally important to recapture losses in the subsequent recovery.
The chart below shows the capture ratios of the value and growth investment styles across the four bear market recoveries.
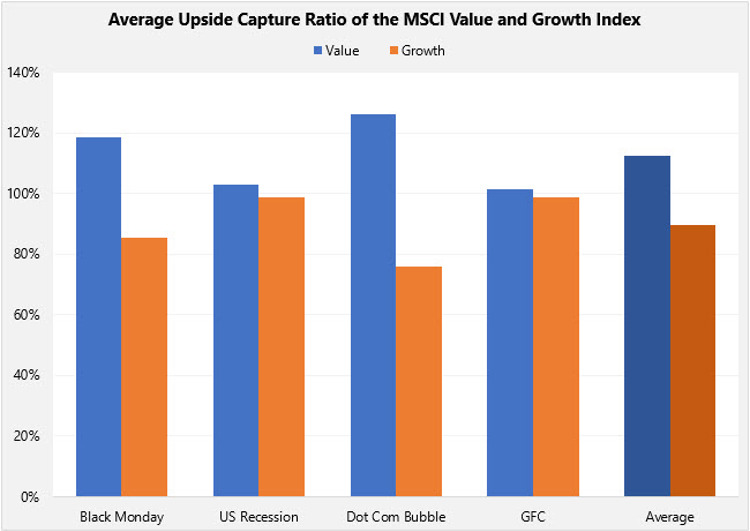
Source: Reuters
We found that value has performed better than growth over the period that it took the MSCI World Index to return to its previous high. On average, value captured 112% of the market return over the recovery period compared to 90% for growth.
Putting this all together
From a historical context, it appears that value has performed better in many of the highlighted instances. However, as we have seen with COVID-19, there are no guarantees that history will repeat. As such, we believe that picking the market inflection point is fraught with danger.
Ultimately, we believe that maintaining a diversified portfolio of high-quality value and growth managers will yield the best outcome over the long-term.