Given the ramp up in advertising in recent years by Industry Super Australia, retail investors are increasingly (and rightfully so) comparing their performance to that of industry super options. However, due to limited information, this comparison is not straightforward, and we think it’s important to shed some light on a complex topic and provide investors with the knowledge to appropriately ‘compare the pair’.
Not all portfolios are created equal!
A lot of the above-mentioned advertising focuses on comparing Balanced portfolios. However, what constitutes a Balanced portfolio isn’t standardised. Zenith advocates for a 60%/40% split in terms of growth and defensive assets. At a very basic level, growth assets are riskier investments, such as equities, property and certain alternatives. Defensive assets typically include traditional fixed interest and cash. However, without an industry standard as to what constitutes a growth or defensive asset, differences in categorisation leads to portfolios with the same branding (e.g. Balanced) having divergent levels of embedded risk.
To further complicate matters, industry super fund investment portfolios often exhibit a lower level of transparency, partly due to their significant exposures to unlisted assets. As a result, investors in industry funds often have limited detail as to what they’re invested in and where the risks lie.
That said, from what we’ve observed in a low rate environment, some industry super funds and some retail super funds have used part of their unlisted asset exposure to replace low yielding fixed income exposures. These assets create a grey area, as they could be classified as being growth, defensive or a combination of each, depending on your view.
Given their size, continued strong inflows of SG contributions (compulsory superannuation contributions) and a typically young membership base, industry super funds are able to take on the illiquidity risk associated with such assets. While we see the merit in investing in these types of assets, given appropriate vehicles and time horizons, these assets have a higher level of risk than traditional fixed income. In our view, based on the return profile, illiquidity risk, the level of gearing, and the experience of unlisted property assets during the GFC, we would argue they’re growth assets.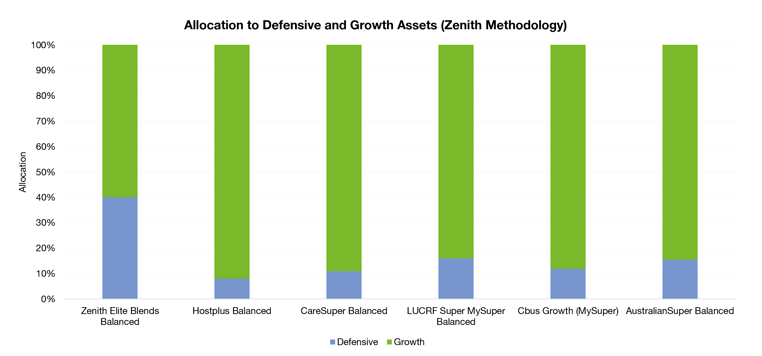
This level of subjectivity when classifying assets has a material impact on the growth/defensive split of portfolios. In the chart above, we’ve reclassified the assets as per our definition of growth and defensive assets for a subset of industry super funds to demonstrate the deviation from a typical Balanced split of 60% growth/40% defensive assets.
An example of this asset allocation is the AustralianSuper Balanced pre-mixed portfolio that has a 15% allocation to income assets and an 85% allocation to growth assets based on Zenith’s asset class definitions. This is a far cry from a 60%/40% Balanced portfolio and more aligned to our Growth or even High Growth risk profiles. This dispersion in asset allocation makes it challenging for investors to compare the absolute performance of industry super funds to that of portfolios with the same risk profile name.
Investors need to keep this in mind when looking at performance league tables. Depending on the table, a Balanced option could have anything from 50 to 80% growth assets, which could be even higher depending on how direct property and infrastructure are classified by the super fund. In short, the name of the investment option does not mean the underlying asset allocation and therefore risk level is equivalent for all investment options with the same name.
Don’t forget about tax!
As per industry super fund standards, performance results are disclosed after tax which will account for tax payable and a franking credit rebate. Conversely, many model portfolios will not disclose performance results net of tax. Unlike industry super funds, model portfolios can be invested in several capacities (e.g. individual, company, trust, etc.) all of which are taxed differently. Therefore, it is not feasible to accurately disclose after-tax returns for model portfolios. This is an additional layer of complexity that makes performance comparisons even more cumbersome.
How do I make a fair comparison?
In an effort to overcome this dilemma, we’ve compared a subset of industry super funds, using either the MySuper option or risk profiles termed ‘Balanced’, to that of Zenith’s rated “Multi-Asset – Balanced” universe and Zenith’s Elite Blends Balanced portfolio. To form a sense of standardisation, we’ve compared the five-year annualised return (after investment fees and tax) against the Strategic Asset Allocation (SAA) to growth assets (reclassified under Zenith’s categorisation of defensive and growth assets).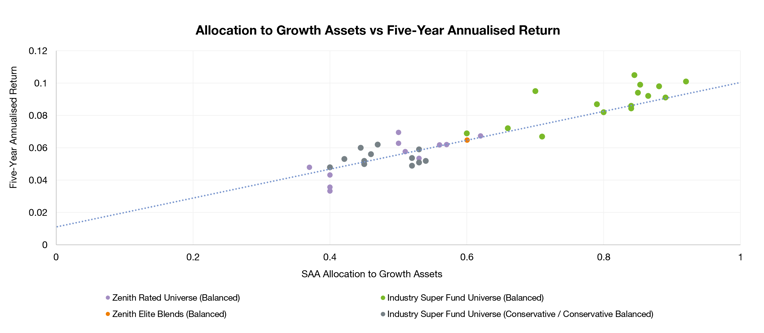
Zenith categorises funds in the “Multi-Asset – Balanced” peer group (greater than 35% exposure to growth/alternative assets and up to 60%) based on our collective assessment of their targeted asset mix and actual portfolio holdings.
From the chart above, it’s clear that the average allocation to growth assets for industry super funds (Balanced) subset is substantially higher than the 35% to 60% range for the Zenith “Multi-Asset – Balanced” peer group. This gives context for industry super funds having higher absolute performance results over the medium term, particularly given the positive performance in direct property/infrastructure assets.
To enable a fair comparison, we have included a trendline based on our rated universe that represents the anticipated level of five-year annualised return for all allocations to growth assets. Despite their higher allocation to growth assets, the industry super fund (Balanced) subset’ average five-year annualised return is broadly in line with the return expectations trendline.
We’ve also included a subset of industry super funds with risk profiles termed ‘Conservative’ or ‘Conservative Balanced’ as the allocation to growth assets for these portfolios is more aligned with the “Multi-Asset – Balanced” peer group using Zenith’s methodology. Similar to the Balanced industry super fund subset, the Conservative / Conservative Balanced subset broadly follows the expected return trendline.
Conclusion
Investors need to be aware that the name of an industry super fund risk profile is often not indicative of the level of embedded risk. In most cases, industry super funds allocate a much higher exposure to growth assets and therefore their absolute performance is not comparable to portfolios with the same risk profile name or volatility (i.e. they are riskier). Before choosing a super option, it’s vital for investors to look under the hood and ensure the allocation to growth assets is consistent with their ability and willingness to assume risk.
We understand the limitations of the above study, given the lower transparency around some of the unlisted assets invested in by industry super funds and due to the assumptions required. Nonetheless, we believe it highlights that performance across all Super options is broadly consistent over the medium to long term, and as one would expect, that asset allocation is the main driver of return dispersion.
‘Your Future, Your Super’ creating new hurdles
A new dimension in ‘comparing the pair’ investors should consider is the obstacle industry super funds now face managing both absolute and relative (benchmark aware) performance.
As part of the Government’s Your Future, Your Super reform package, MySuper options are now subject to an annual performance test, which assesses the fund’s performance over a rolling 8-year period (seven years for the first test), relative to its SAA benchmark. This means fund returns (net investment return, less admin fees for the last financial year) are measured against the return of a benchmark portfolio (less median MySuper admin fee for the last financial year) with the same asset allocation, using various market indices for each asset class.
There are limitations to this methodology, including the fact that the test merely evaluates how well a fund has implemented its SAA, not the efficacy of the SAA itself. Also, some assets don’t match the market indices that are used, including low volatility equities, defensive alternatives and real return multi-asset strategies, resulting in some funds failing the test primarily due to having these assets in their portfolios.
There are also a number of other unintended consequences including the potential fixation on reducing the risk of failing the test which could prove detrimental to long-term member outcomes. Funds may strategically lower their tracking error or ‘hug’ the underlying indices to which their SAA is benchmarked. Conversely, funds materially lagging the performance test may be tempted to take on undue risk as a ‘Hail Mary’ to pass the test. This ‘fear of failure’ means benchmark unaware strategies have become inherently riskier propositions in terms of passing the test, even those which aim to reduce risk.
The government is right to provide greater scrutiny over perennial under-performing funds, but the nature of the current test means some funds that have been doing a reasonable job for their members will fall foul of the test and may struggle to retain their members. Perhaps that is the collateral damage of ensuring all members are in well-performing funds, which is the ultimate goal after all.