
Cash (or CPI) Plus Objectives
Before answering how to measure the performance of a multi-asset portfolio, it’s important to understand their purpose and how they’re constructed. A multi-asset portfolio is designed to meet an investor’s objective, based on their risk tolerance and investment timeframes.
Commonly, this objective is stated as a Cash or Consumer Price Index (CPI) Plus target, which considers the risk-free rate, or inflation, with an additional percentage added based on the portfolio’s risk profile and overall asset allocation. It’s important to understand that cash plus measurements don’t fully capture market cycles but are intended as targets over appropriate time horizons.
The alternative is to use the current CPI rate instead of the risk-free cash rate, this provides a greater emphasis on after inflation returns, otherwise known as “real” returns. For investors, this is what they likely care about as they’re seeking to maintain a consistent standard of living. However, over the past few decades, cash and CPI have been closely aligned, so the choice of either has been largely irrelevant.
Under the most common methodology, known as mean variance optimisation, to construct a multi-asset portfolio, assets are combined in a mix that has the best chance to achieve the stated objective with the least amount of volatility. Of course, it’s possible to use alternative methodologies, such as lowest drawdown potential, but such measures are typically considerations in the construction process.
What is a Benchmark?
Benchmarks are objective measuring tools to track portfolio performance. Investors commonly think of benchmarks as single asset class market indices which fund managers measure their performance against and signal to investors their investable universe. For example, an Australian large cap fund will typically use the S&P/ASX 200 Accumulation Index as its benchmark, while an Australian small cap fund will benchmark against the S&P/ASX Small Ordinaries Accumulation Index.
When considering diversified multi-asset portfolios, the ability to appropriately assign one overarching benchmark is challenging as multiple asset classes feature in a single investment solution. Furthermore, as multi-asset portfolios can be dynamically managed, their strategic asset allocation (SAA) may deviate materially over time, meaning so too must their benchmark. Investors therefore must accept that multi-asset benchmarks are imperfect and should measure their portfolio success in the context of meeting or exceeding their investment goals and objectives.
Types of Benchmarks
Common Single Asset Class Benchmarks
These indices are typically assigned to managed funds whose underlying investments fall into a single sector such as Bonds, Shares and Property. The below table reflects the most common benchmarks used by the various asset classes that feature within a multi-asset portfolio. Using one of these benchmarks alone will lack the diversification reflected in the portfolio’s underlying asset allocation, causing an incomparable performance between the portfolio and benchmark.
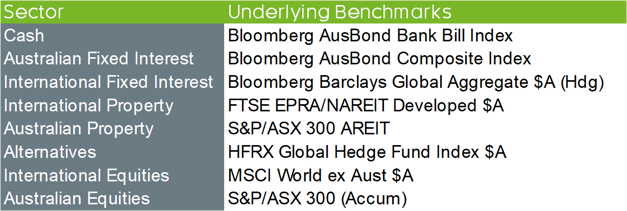
Source: Zenith Investment Partners
Strategic Asset Allocation (SAA) Benchmarks
An SAA benchmark involves comparing the portfolio’s return to that of a hypothetical benchmark portfolio with the same asset allocation, using a relevant index for each asset class, as outlined above. The performance test introduced in the Government’s Your Future, Your Super (YFYS) reform package suggests that an SAA benchmark is the fairest method of measuring portfolio performance, at least from a regulatory standpoint. To clarify ‘fairest’, an SAA benchmark may well be the closest thing we have to an ‘apples with apples’ comparison, which is important given a ‘balanced’ portfolio can vary widely in both its overall defensive / growth split and underlying asset class mix.
It’s important to understand that an SAA benchmark does not consider the fees required to replicate the underlying SAA and some asset class benchmarks, particularly within Alternatives, may not be investable. This dispels the commonly held belief that an SAA benchmark return represents the true opportunity cost for an investor, i.e., “what my portfolio could have returned”. To even the playing field, the YFYS benchmark applies the median MySuper admin fee for the previous financial year (50 basis points) in recognition that returns can’t be achieved without fees.
The main limitation to this unidimensional methodology is that an SAA benchmark merely evaluates how well a portfolio has implemented its SAA, not the efficacy of the SAA itself, i.e. does the mix of assets represent the optimal means to achieve the portfolio objective? This begs the question, should clients care about beating a hypothetical SAA benchmark? Remember, a portfolio can outperform an SAA benchmark with a negative return. Therefore, we believe the optimal benchmark is one that is intrinsically linked to the investor’s objectives and investment timeframe.
The below charts track the Growth of $100,000 of common asset class benchmarks over the past decade against our Diversified Market Balanced Benchmark assigned to our Elite Blends Balanced Portfolio (60%/40% Growth/Defensive split). The growth of International Shares has far outstripped the SAA Balanced Benchmark during a bull market with few large drawdowns other than the COVID-19 period and the 2022 inflation spike. If an investor is agnostic to risk, (volatility) then a portfolio solely consisting of shares may be more appropriate. However, this contravenes the purpose of a multi-asset portfolio, which is to provide a smoother return profile over the market cycle.
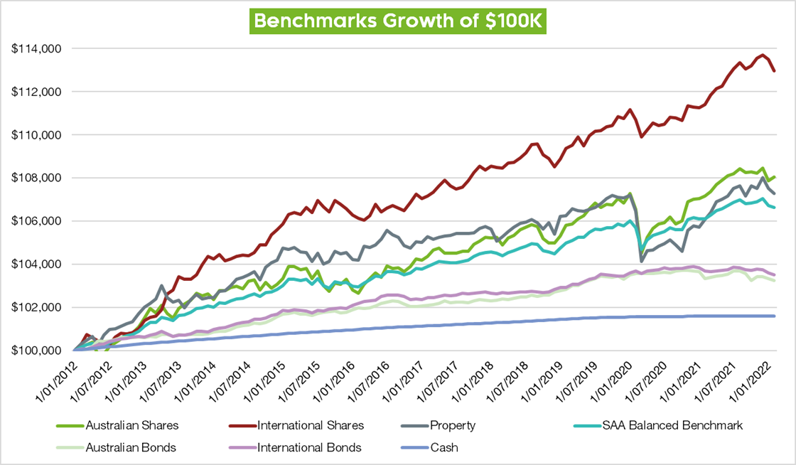
Source: Refinitiv
Conclusion
While multi-asset benchmarks come in many forms, none are a perfect measure of portfolio performance. However, we recognise that benchmarks play a role in tracking how portfolios are performing. As markets move in cycles, we believe cash plus objectives are the most effective benchmarks to guide investors towards their financial goals.


